Watch: how a Noise Risk Report works
AcoustaPLOT — the Noise Risk Report, explained in a minute
One number, against the levels that matter
You get your noise level, day and night, and the band it falls in. Above roughly the moderate-high level, national policy expects councils to take noise into account when deciding whether new homes should be built nearby — so knowing where you sit is worth thirty-five pounds before a much larger decision.
Where an address sits on the scale
Sample property · illustrative
What that actually sounds like
Sixty-one decibels is a conversation you cannot turn off. The report puts your level next to familiar sounds — a library, a conversation, a vacuum, a busy road — so the number means something.
What’s included
- Noise risk band for your address
- Lden & Lnight at the property
- Familiar sound comparisons
- Indoor estimate against BS 8233
- Branded PDF, delivered in seconds
Noise Risk Report
Not a verdict. A starting point.
If it comes back low, you have saved yourself everything else on this page.
Check my property →What this is — and what it isn't
- Automated and modelled — produced by our software from national datasets, not measured at your property.
- No site visit and no individual human review of your report.
- Every report states its uncertainty range. Figures are estimates within that range.
- Not suitable as the sole or primary evidence for a planning application or appeal, legal proceedings, an insurance claim, or anything else needing a precise measured level.
- In a purchase or price negotiation it is supporting context for your own decision — not a valuation, and not a measured figure the other side has to accept.
If you need a figure that will stand up for planning, a legal dispute or an insurance claim, you need a measured survey by a qualified acoustic consultant — not this report. We will tell you that rather than sell you the wrong thing.
The demo report, page by page — watermarked, illustrative figures
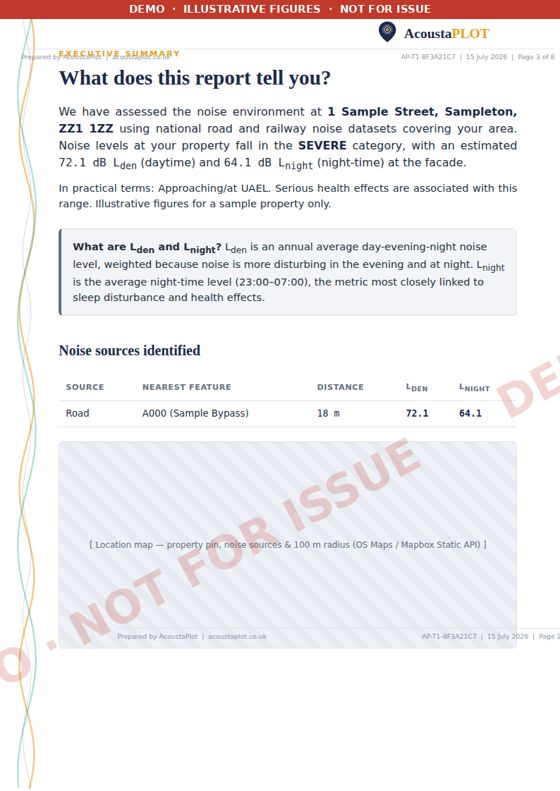
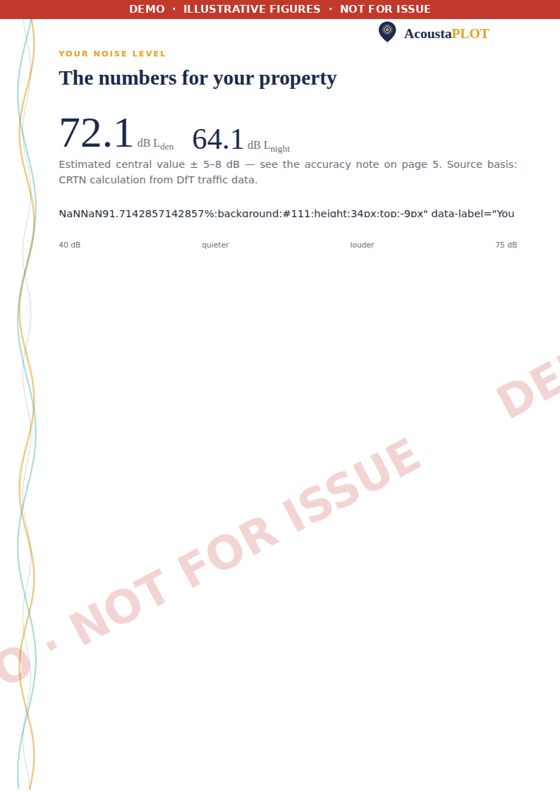
Demo pages from a fictional sample property — not a real assessment
Built on the national datasets
Modelled from national datasets with the standard UK methods — and labelled as modelled, always.
Questions buyers ask
What exactly do I get for £34.99?
Your address's noise-risk band, the modelled day and night levels (Lden and Lnight), familiar-sound comparisons, an indoor estimate against BS 8233, and a branded PDF — delivered in seconds.
How can you assess my address without visiting?
We model it from national datasets — real DfT traffic counts, Defra noise mapping and the road network — using CRTN 1988, the UK's standard road-noise method. It is a desktop model, and the report says so plainly, with its uncertainty range stated.
Will this tell me whether to buy the house?
No — it tells you how loud the address is modelled to be, and what that level means in practice. The decision stays yours. If the result comes back low, you may have saved yourself every further pound on this page.
Can I use the result in a planning application?
Not on its own. Planning authorities generally expect measured, on-site data. If that is your situation, the route is a measured acoustic survey — we say this on every report rather than let you find out at committee.
Every AcoustaPLOT report is a desktop model — fast, honest about its uncertainty, and the right tool before a decision. Where a figure must stand up formally, for planning or a dispute, the route is an on-site measured survey by a qualified acoustician. How that works →
Audio simulation (real road/rail, not white noise) · Aerial view with noise overlay · 24-hour day/night profile.